Magnetic Pole Shift:
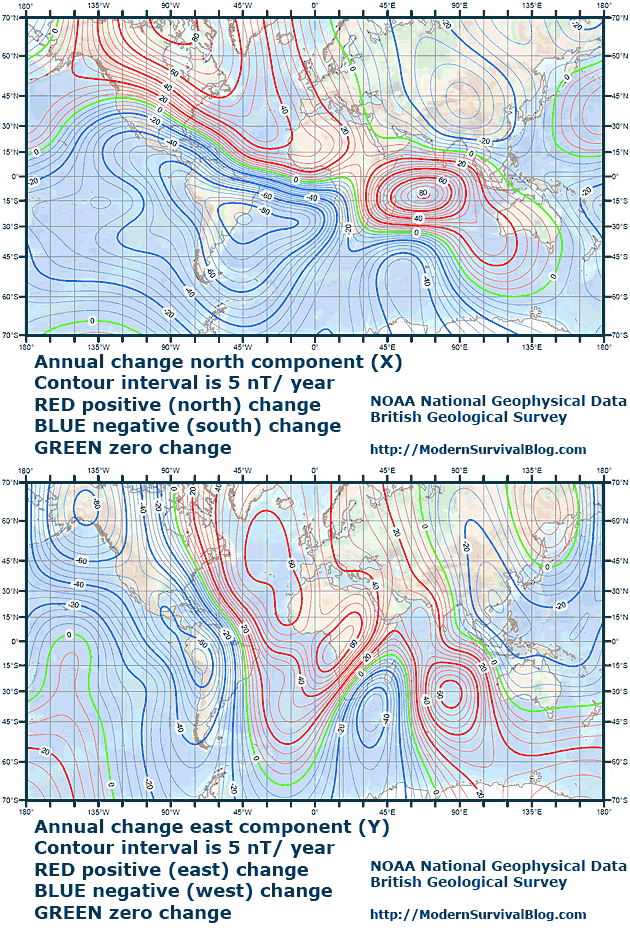
The annual rate of change of magnetic pole shift, as calculated by the British Geological Survey Geomagnetism Team and the NOAA National Geophysical Data Center, indicates that the southeast United States is evidently affected the most each year (calculations through 2015) as well as northeastern South America.
The magnetic north pole is rapidly drifting towards Russia while the effects are being felt in the U.S. and elsewhere. So far, the effects have included some airport runway number changes (the number is assigned based on the compass heading the runway is pointed to, multiplied by ten). No doubt that many navigational charts and maps will be edited in the years to come.
Some say that rapid changes in the orientation of the magnetic poles can create problems with animals – birds – insects (bees) that rely on the magnetic pole orientation in their travels and behavior.
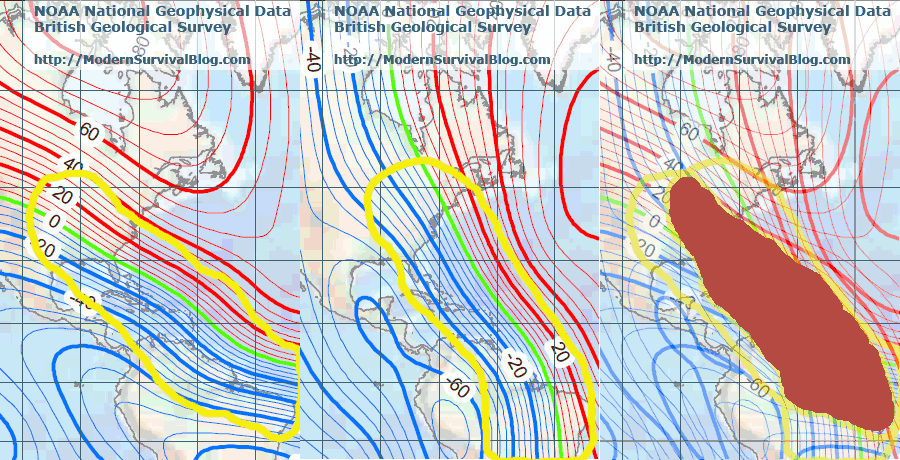
Given the rate at which the magnetic north pole movement has increased during the last few years, I thought it would be interesting to overlay two plots of magnetic ‘rate of change’ (north-south and east-west, or, the X-Y components), so to discover if their are overlapping regions of high rates of change. This would indicate that those regions are being affected the most by the current magnetic pole shift.
As it turns out, there is a large swath of tightly contoured, overlapping high rate of change, that stretches from around Wisconsin – Indiana down through the southeast U.S., and continues all the way through northeastern South America.
If there is such a thing as magnetic stress as it relates to the speed at which the magnetic field is changing in both the X and Y components, then this simple chart overlay indicates where that is.
In today’s world of GPS navigation, you could say that it doesn’t matter much to us humans. You might say that a few degrees of magnetic shift is only an additional calculation to be made while reading older maps. But who’s to say what effects may be occurring elsewhere. Fault zones? What about the underlying cause of our shifting poles… the mechanism that is causing this could be the same mechanism that causes other things to occur – changes in the Earth’s inner dynamo.
One could speculate all they want about how to interpret the data. So, here is some data that is interesting to look at it. Make with it what you may.
If you enjoyed this, or topics of preparedness or current events risk awareness, consider our survival blog RSS feed, new posts by E-mail, or bookmark us at Modern Survival Blog
Modern Survival Blog related posts
Incoming search terms:
http://feedproxy.google.com/~r/ModernSurvivalBlog/~3/BX59sNlzW48/


No comments:
Post a Comment
Note: only a member of this blog may post a comment.