Precious metals are proving resilient after yesterday’s beat-down. Gold is back up to $1,461. Silver spent a few nanoseconds below $40 yesterday and as of this writing sits smartly at $40.56.
With regular runs at historic highs, it’s no longer cranky gold bugs and dollar bears doing their share of gold price forecasting. Analysts for the proper, if stodgy, British bank Standard Chartered announced yesterday they are expecting gold to reach $2,107 an ounce by 2014.
What’s more, they say, “our modeling suggests a possible ‘super-bull’ scenario,” based on a “powerful relationship” between per capita income in Asian emerging markets and the gold price.
Standard Chartered estimates that per capita income in China and India will reach 30% of the US level over the next 20 years. On that basis, the bank sees “gold prices rallying up to $4,869 per ounce by 2020, should current relationships between Asian demand and gold persist.”
Standard Chartered wouldn’t find much argument from US Global Investors chief and Vancouver alum Frank Holmes, who was the lunchtime keynote presenter here in Zurich today at the European Gold Forum.
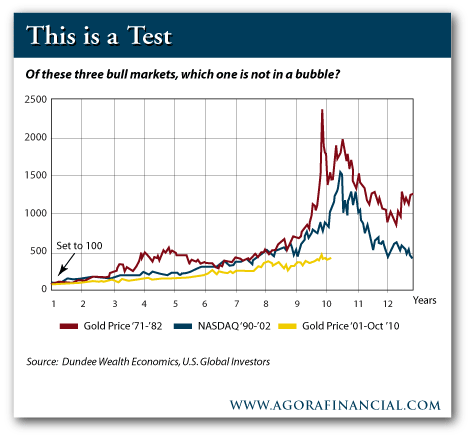
For starters, he furnished visual evidence to back up Marc Faber’s claim in this space on Monday that gold is not in a bubble.
You’ll see the chart follows the trajectory of three bull markets – gold beginning in 1971, the NASDAQ beginning in 1990 and gold again beginning in 2001.
“Bubbles require massive leverage,” Frank says, and there’s no evidence investors are borrowing to load up on gold.
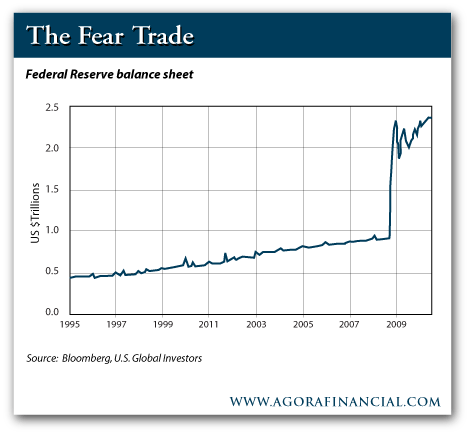
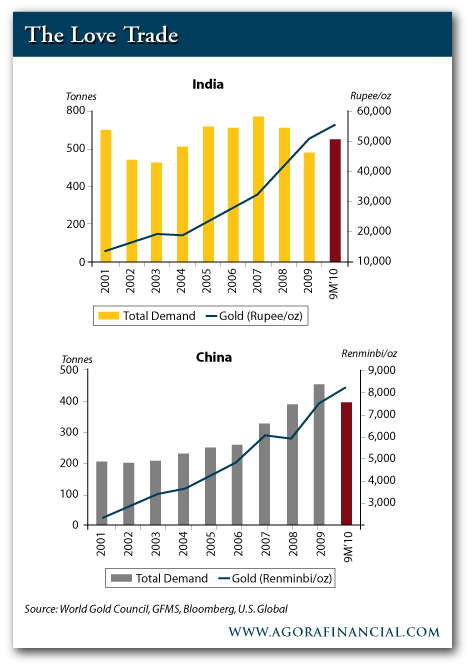
For now, gold demand will increase steadily, driven by two of Frank’s favorite themes – the “fear trade” and the “love trade.”
That is, investors buy gold because they fear what the Federal Reserve is doing with its balance sheet…
The result – negative real interest rates. That’s when inflation is greater than the nominal interest rate. “Whenever you have negative real interest rates coupled with increased deficit spending,” says Frank, “gold tends to rise in that country’s currency.”
Likewise, the two party blockade on fiscal reform writ large in the US Congress.
The “love trade,” on the other hand, is something alien to North Americans and Europeans. “It is customary in most emerging countries to give gold as a gift to friends and relatives for birthdays, weddings, and to celebrate religious holidays,” he explains.
Thus, the point to which Standard Chartered agrees: As incomes rise in China and India, jewelry demand is driving the “love trade.”
Gold demand in India during the first three quarters of 2010 exceeded all of the previous year. And China was on a pace to exceed the 2009 figures as well… all of that despite a steadily rising gold price all last year.
Addison Wiggin
for The Daily ReckoningVisual Evidence to Disprove the “Gold Bubble” Theory originally appeared in the Daily Reckoning. The Daily Reckoning recently featured articles on stagflation, best libertarian books, and QE2 .
http://feedproxy.google.com/~r/dailyreckoning/~3/X1K-JlBYjto/


No comments:
Post a Comment
Note: only a member of this blog may post a comment.