NASA blogger Gavin Schmidt has once again fabricated claims against Climate Audit – this time falsely claiming that, despite advice from “wiser” heads, I had “predicted” the impact of the Thompson et al 2008 article on bucket adjustments on HadCRU revisions and that my “prediction” had now been shown to be wildly incorrect. Schmidt’s article, insofar as it concerns Climate Audit, is totally untrue.
CA readers are aware that I discussed bucket adjustments on a number of occasions long before Thompson et al 2008. In May 2008, upon publication of Thompson et al 2008, I reviewed the prior CA posts and slightly updated a Climate Audit graphic made a year before Thompson. I did not try to “predict” the institutional climate community response to the error that Thompson had pointed out. Readers can readily guess what I would have predicted had that been the purpose of my prior post.
Climate Audit on Bucket Adjustments
I’ve done a number of posts on bucket adjustments – which, as I’ve observed on a number of occasions – is a much under-discussed topic given that the adjustments are quantitatively as large as the trend being measured and rest on a rather frail historic foundation. (The SST data in data are just as much in need of careful attention from independent statisticians as land station data.)Very early in CA history (for example here), I had pointed out the critical dependence of SST trends on “bucket adjustments”. In particular, I pointed out the importance and apparent implausiblity of the Folland assumption of an instantaneous change from buckets to engine inlets at Pearl Harbour – an assumption that was common to seemingly “independent” SST estimates. The Folland assumption was stated as follows:
The abrupt change in SST in December 1941 coincides with the entry of the USA into World War II and is likely to have resulted from a realization of the dangers of hauling sea buckets onto deck in wartime conditions when a light would have been needed for both hauling and reading the thermometer at night.
Fast forward to March 2007. I noticed the following remarkable graphic showing that, as of 1970, buckets were still very much in use:
CA reader Carl Smith commented:
…it looks to me like the WWII records were dominated by engine-warmed intake data, perhaps because the chaos meant much of the bucket data did not get recorded, and after WWII it was business as usual with mostly bucket data resuming.
The next day, I re-examined the Pearl Harbour hypothesis, carrying out a calculation on the basis of Carl Smith’s suggestion as follows:
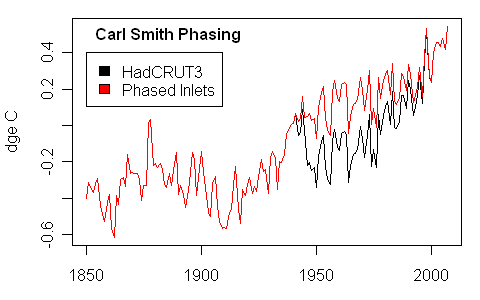
Let’s suppose that Carl Smith’s idea is what happened. I did the same calculation assuming that 75% of all measurements from 1942-1945 were done by engine inlets, falling back to business as usual 10% in 1946 where it remained until 1970 when we have a measurement point – 90% of measurements in 1970 were still being made by buckets as indicated by the information in Kent et al 2007- and that the 90% phased down to 0 in 2000 linearly. This results in the following graphic:
In December 2007, still long before Thompson et al, I discussed bucket adjustments again, noting the impact of the Folland adjustments on earlier work (referring to Paltridge and Woodruff 1981).
When Thompson et al 2008 was published, Nature announced that the new article called “attention to a previously overlooked discontinuity in the record at 1945″.
In the CA post, I referred to the discussions the previous year and showed the illustration under “Carl Smith Assumptions” once again and once again listed those assumptions (based on the Kent diagram).
In my commentary on Thompson et al, I quoted the following paragraph on bucket methodology changeover:
The most notable change in the SST archive following December 1941 occurred in August 1945. Between January 1942 and August 1945, ~80% of the observations are from ships of US origin and ~5% are from ships of UK origin; between late 1945 and 1949 only ~30% of the observations are of US origin and about 50% are of UK origin. The change in country of origin in August 1945 is important for two reasons: first, in August 1945 US ships relied mainly on engine room intake measurements whereas UK ships used primarily uninsulated bucket measurements, and second, engine room intake measurements are generally biased warm relative to uninsulated bucket measurements.
I compared this information to the assumptions that I had made the previous year as follows:
In our estimate, we hypothesized a wartime changeover to about 75% engine inlet, with business as usual after the war, then gradually going to the 1970 distribution of Kent et al 2007. Thompson et al estimate 80% changeover to engine inlet during the war, with a return to business as usual after the war.
I then provided an “updated version of the graphic posted up last year using data downloaded today” (this is the graphic shown by realclimate – see below).
In the post in question, I made a slight update of a graphic showing the implication of a bucket scenario proposed by reader Carl Smith – a graphic that had been placed on CA a year earlier. All of this is very evident in the CA post linked by Schmidt.
Now here is Schmidt’s account:
Back in 2008, a cottage industry sprang up to assess what impact the Thompson et al related changes would make on the surface air temperature anomalies and trends – with estimates ranging from complete abandonment of the main IPCC finding on attribution to, well, not very much. While wiser heads counselled patience, Steve McIntyre predicted that the 1950 to 2000 global temperature trends would be reduced by half while Roger Pielke Jr predicted a decrease by 30%. The Independent, in a imperfectly hand drawn graphic, implied the differences would be minor and we concurred, suggesting that the graphic was a ‘good first guess’ at the impact (RP Jr estimated the impact from the Independent’s version of the correction to be about a 15% drop in the 1950-2006 trend). So how did science at the speed of blog match up to reality?
Far from the graphic at CA being a rush to judgement as Gavin Schmidt alleged, the CA graphic was a very slight modification of a graphic made over a year earlier, incorporating new information from the Thompson article.
Nor did I, as Schmidt alleged, “predict that the 1950 to 2000 global temperature trends would be reduced by half”. My article did nothing more than make a ball-park estimate of the impact of different and seemingly plausible assumptions on the changeover from buckets to engine inlets. Nothing in my article remotely resembles a “prediction” of how HadCRU and similar organization would deal with the apparent error.
If I were making a prediction about how the climate community would respond to an apparent error, I would have predicted that they would say that it didn’t matter. In that sense, what I would have predicted has in fact come about.
And, oh yes, attentive CA readers may recall that the CA post criticized by Schmidt today was also criticized in a notorious Climategate email as follows:
891. 1212063122.txt
>> Mike,
> Can you delete any emails you may have had with Keith re AR4?
> Keith will do likewise. He’s not in at the moment – minor family crisis.
>
> Can you also email Gene and get him to do the same? I don’t
> have his new email address.
>
> We will be getting Caspar to do likewise.
>
> I see that CA claim they discovered the 1945 problem in the Nature
> paper!!
>
> Cheers
> PhilFrom: Michael Mann
To: Phil Jones
Subject: Re: IPCC & FOI
Date: Thu, 29 May 2008 08:12:02 -0400Hi Phil,
laughable that CA would claim to have discovered the problem. They would
have run off to the Wall Street Journal for an exclusive were that to
have been true.
I’ll contact Gene about this ASAP. His new email is: generwahl@yahoo.com
talk to you later,
mike
http://climateaudit.org/2011/07/11/more-misrepresentations-from-realclimate/

No comments:
Post a Comment
Note: only a member of this blog may post a comment.